Playboard Perspective: Internal Activity and Engagement At-a-Glance
Playboard Perspective: Internal Activity and Engagement At-a-Glance

Playboard Product Owner
The power of a tool that impacts relevancy and, consequentially, queries’ performance is huge. As the instrument that controls the Search & Discovery experience, we are always working to ensure that the Playboard is trustworthy and reliable. The question is, how can you have a clear view of everything that’s happening within the Playboard?
A few months back, we shared the news about the granularity of permissions that can be achieved with Empathy Platform; how a tool can have read or write permissions, or be hidden in order to give each of your colleagues the access they need.
Now, you may be asking yourself the same thing many retailers already have: is there a way for me to see how my colleagues interact with the Playboard?
It’s a totally understandable question. Impacting queries’ relevancy and performance directly affects your business, so it is no wonder that permissions and roles just aren’t enough. You want to know who changed what and when, because every factor matters when curating a Search & Discovery experience.
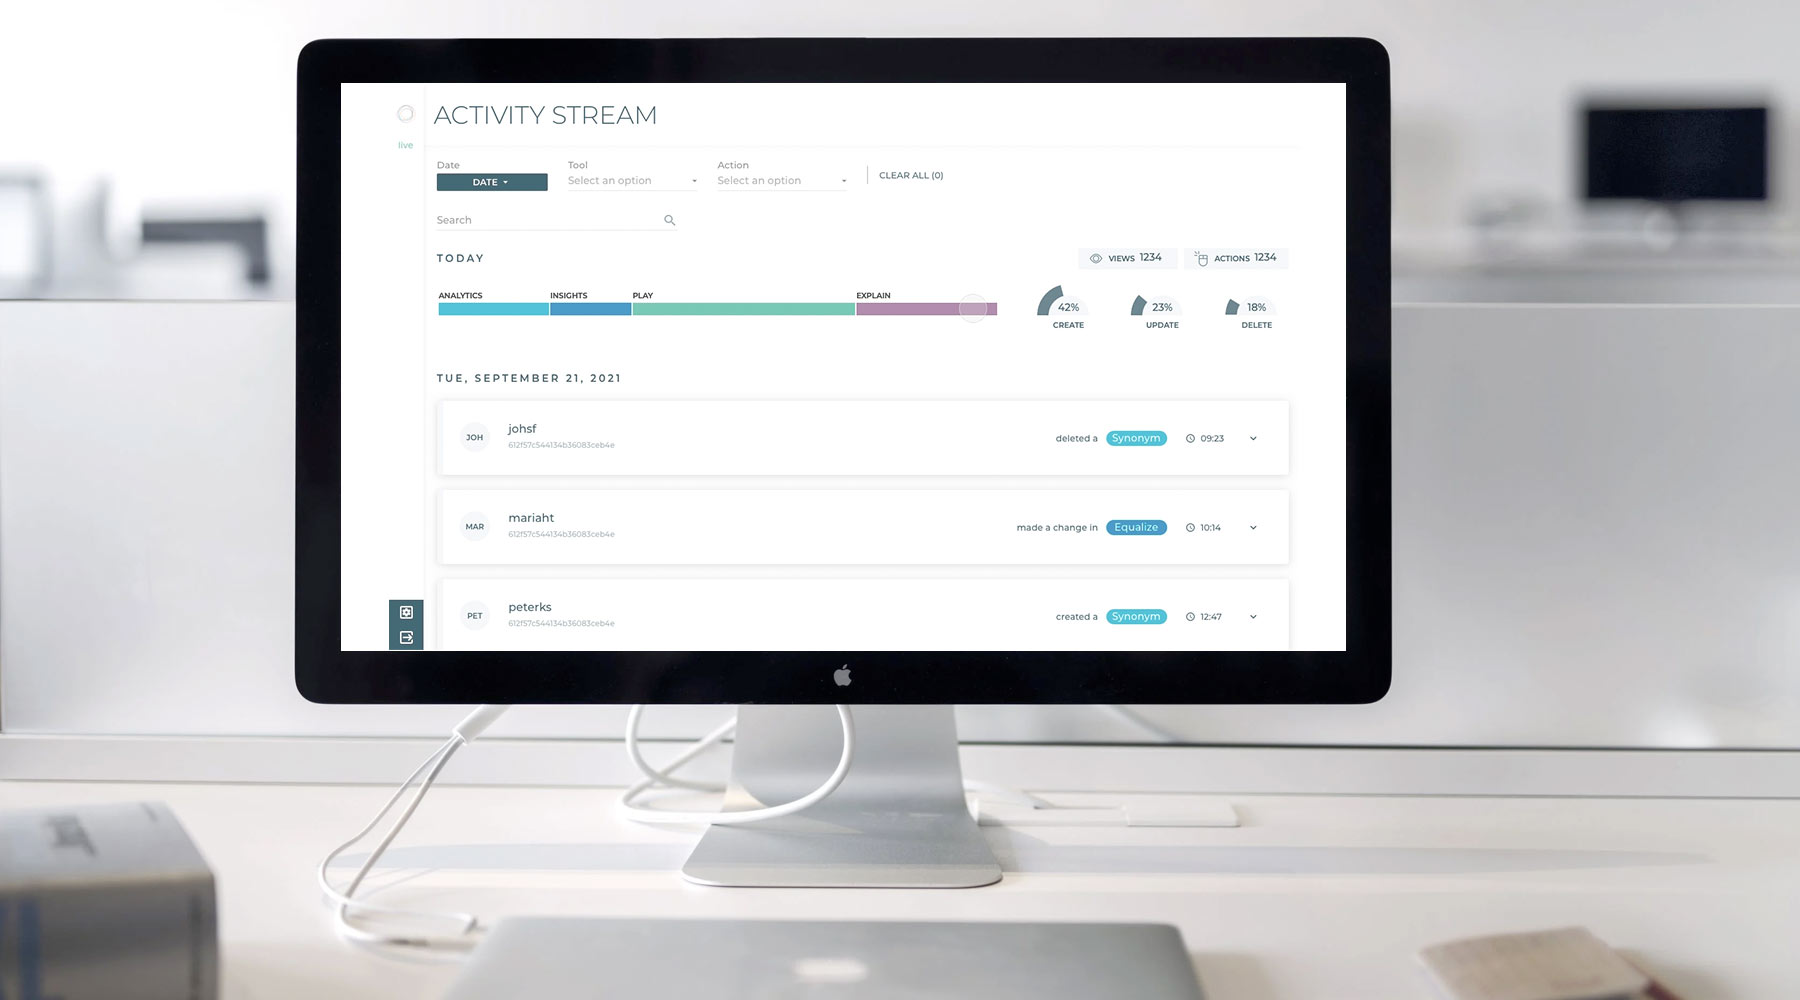
Activity Stream is the game-changing Empathy Platform tool that collects a list of changes made in any of the Playboard tools and displays them on an intuitive interface and measures usage of the tooling. This real-time feature allows activity to be filtered by date range, tool and action.
How are changes documented?
The Actions are listed from newest to oldest and include:
- The email of the user that made the change, with icon and ID
- The action that was performed:
- Create: New configuration added
- Update: Changes made to an existing configuration
- Delete: Removed an existing configuration
- Import: Configurations added via API
- The tool that was impacted, enhanced with a specific colour code for visual interpretation
- The date and time the Action was taken
In the event that more details are needed, the box can be expanded to show additional information that is specific to each tool.
Playboard Engagement Metrics
The ability to understand the engagement of the tooling is something that has been requested by big retailers, as it provides a way to identify room for improvement in the search and discovery strategy, by relaying information that helps determine where efforts would be best invested.
So now, within Activity Stream, you can do just that - explore Engagement Metrics to interpret how your team is putting the Playboard to use.
The tools in the Playboard are grouped into four sections and arranged according to the total number of visits and actions taken during the defined time period (today, the last week, the last 30 days, or a custom range).
Upon entering into a section, its particular tools are then arranged visually from most- to least-used. The usage is then divided into “Views” and “Actions,” the first being those tools that are most frequently visited, but not manipulated; the second consisting of those that are used to create, edit, and delete configurations. The latter is then broken down into the corresponding percentages of use.
The sections are as follows:
- Analytics: Search performance reports and analytics
- Insights: Business case-specific data visualisation and insights from shoppers’ behaviour
- Play: Tooling that orchestrates the search experience
- Explain: Factors behind the ‘whys’ and ‘hows’ of search
When a specific section is selected, the data is reflected accordingly. If a section contains tools within it, they are broken down based on the volume of Actions and Views and ordered by frequency of use. For those elements that were simply viewed, the data regarding actions does not exist.
Transparency is key to grasping the whole picture, and with Activity Stream and Engagement Metrics, there are no mysteries as to where modifications come from. So feel free to examine the changes, see which actions your team takes the most, and enjoy the enhanced, ever-improving Playboard.