Analysing Discovery with Navigation Metrics
Analysing Discovery with Navigation Metrics
Understand what shoppers are browsing for, in order to offer an enhanced experience

Playboard Product Owner
Shoppers’ paths through an ecommerce store offer a wealth of information. With the Navigation Metrics tool in the Empathy Platform Playboard, analysts have a dedicated space to view, investigate, comprehend and transform that data into actionable insights. That’s right, on top of providing powerful tooling to create a customised search experience, Empathy.co also gives brands key insight into the discovery experience – how shoppers navigate.
The way customers discover products as they browse through the catalogue, move between sections and click on categories are organised in one place and ready for analysis. Within the Discovery tab of the Empathy Platform Playboard, the Navigation Metrics are displayed in an interactive tree map that shows the top product categories, which can be analysed based on views, average click position, interactions, findability, add-to-cart and checkout.
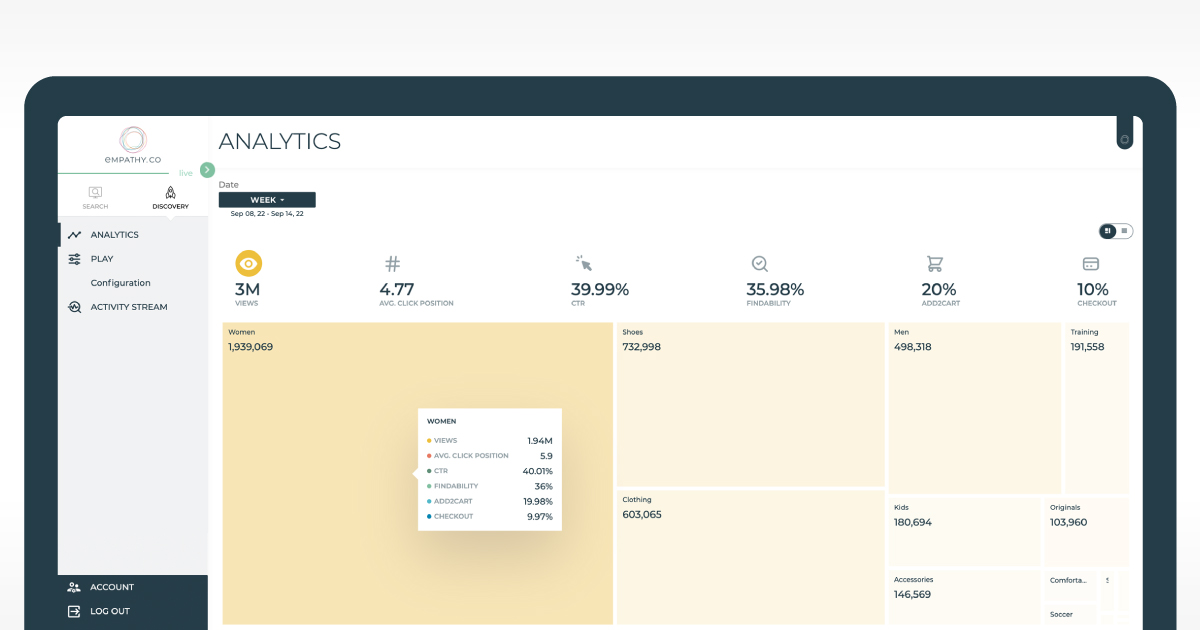
When the tool is opened, a quick preview of each metric is shown, offering retailers immediate insight into the breakdown of how shoppers are interacting with their ecommerce store’s discovery experience. A date range dropdown allows for the time period to be modified quickly, with the option to see analytics for the day, week, month or a custom range.
Simply by clicking on the desired metric, the tree map adapts to reflect the browsing-related data accordingly. This visualisation gives brands the ability to take a deeper look at the analytics that are most pertinent to their business rules, while the other indicators remain close at hand and appear when each specific category is scrolled over. Switching to the Table view presents a list of the metrics for all product categories and conveniently provides the ability to download them as an analytics report.
The Empathy Platform Playboard’s Navigation Metrics tool gives analysts and merchandisers alike a joyful way to understand how shoppers browse for products, making it easy to gather insight and optimise the discovery experience for their customers.